


LEGO Architecture meets BIM – Part 07: Data display on drawings
Introduction
As we have seen in the previous post we can add data to 3D models to create Building Information Models (BIM). This data is embedded in various locations within the model. These for example are Project, Site, Building, Floor (Building Storey), Space, Zone, Component/Element, Type and System. We will see in other posts how we can access this data in the model for various uses by a variety of parties. However, in this post we will focus on how this DATA can be extracted for use in traditional drawing outputs. This data becomes INFORMATION to the reader of the drawing.
There are essentially 2 different ways of displaying data on traditional outputs. The first simply takes information embedded in the model and represents this by placing some form of label or by using a tool that will interpret the geometry, for example to display a dimension or level. The second takes the same data and rather than simply replicating the same information on the drawing, it interprets it and displays it graphically.
For example where using data straight from the model we will see the Colour Type of the LEGO model displayed as either ‘Solid’ or ‘Transparent’ for each LEGO brick. In the graphic example though the same data is represented by a colour for each type – Solid being dark grey and Transparent being a very light grey. In a real world example these graphic overrides could be used to show different Fire Ratings or Wall Types. This graphic display also makes it easier to review model data.
A non-BIM workflow would involve manually placing text directly on drawing outputs. The graphic approach would also need to be a separate process. The issue with this approach is it is disconnected and potentially introduces errors into the process. The aim of using data directly from models is to speed up the process and remove the risk of errors being introduced into the process.
Data output examples
The following are examples of the data within the LEGO model displayed on various types of drawing outputs. All of this data is extracted direct from the model can be used in any combination.
For information, the text in red explains where the data was extracted from in ARCHICAD (i.e. Group / IFC Property Set) and the text in grey shows the out-of-the-box ARCHICAD label objects used to show the data.
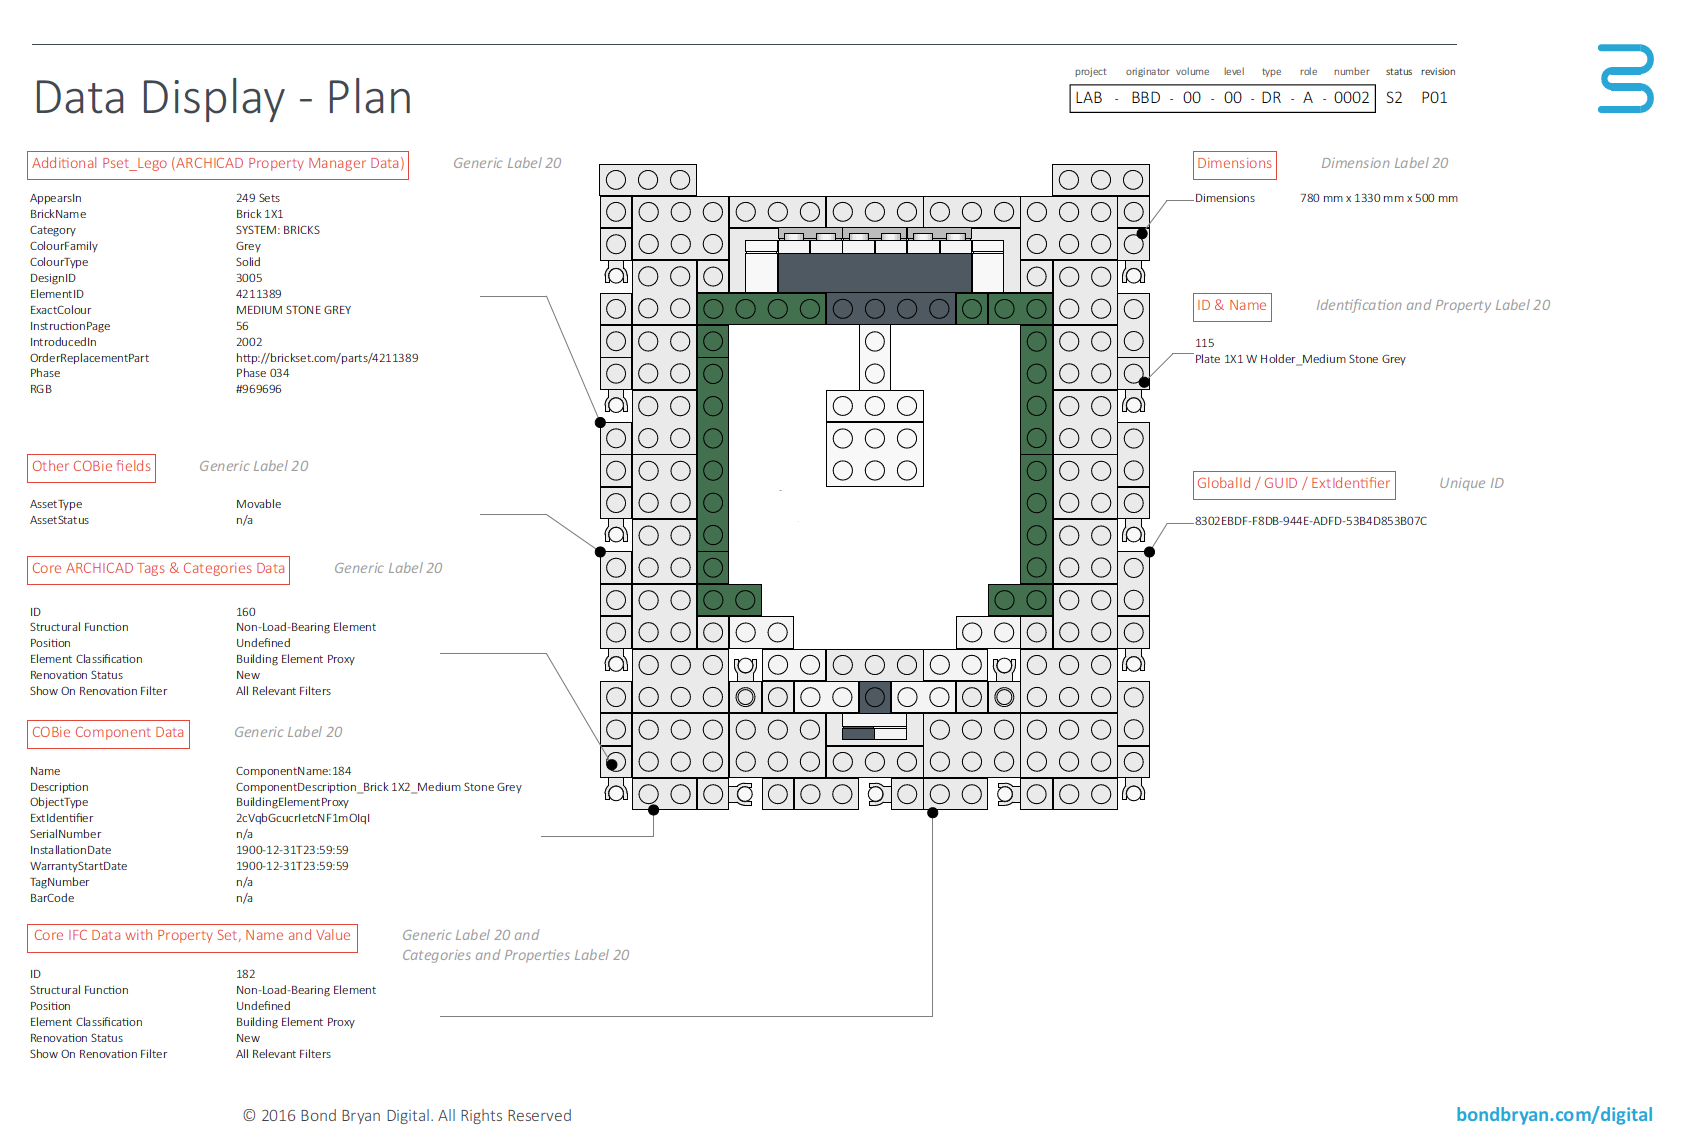
Image: Plan view with information extracted directly from model elements (click to enlarge)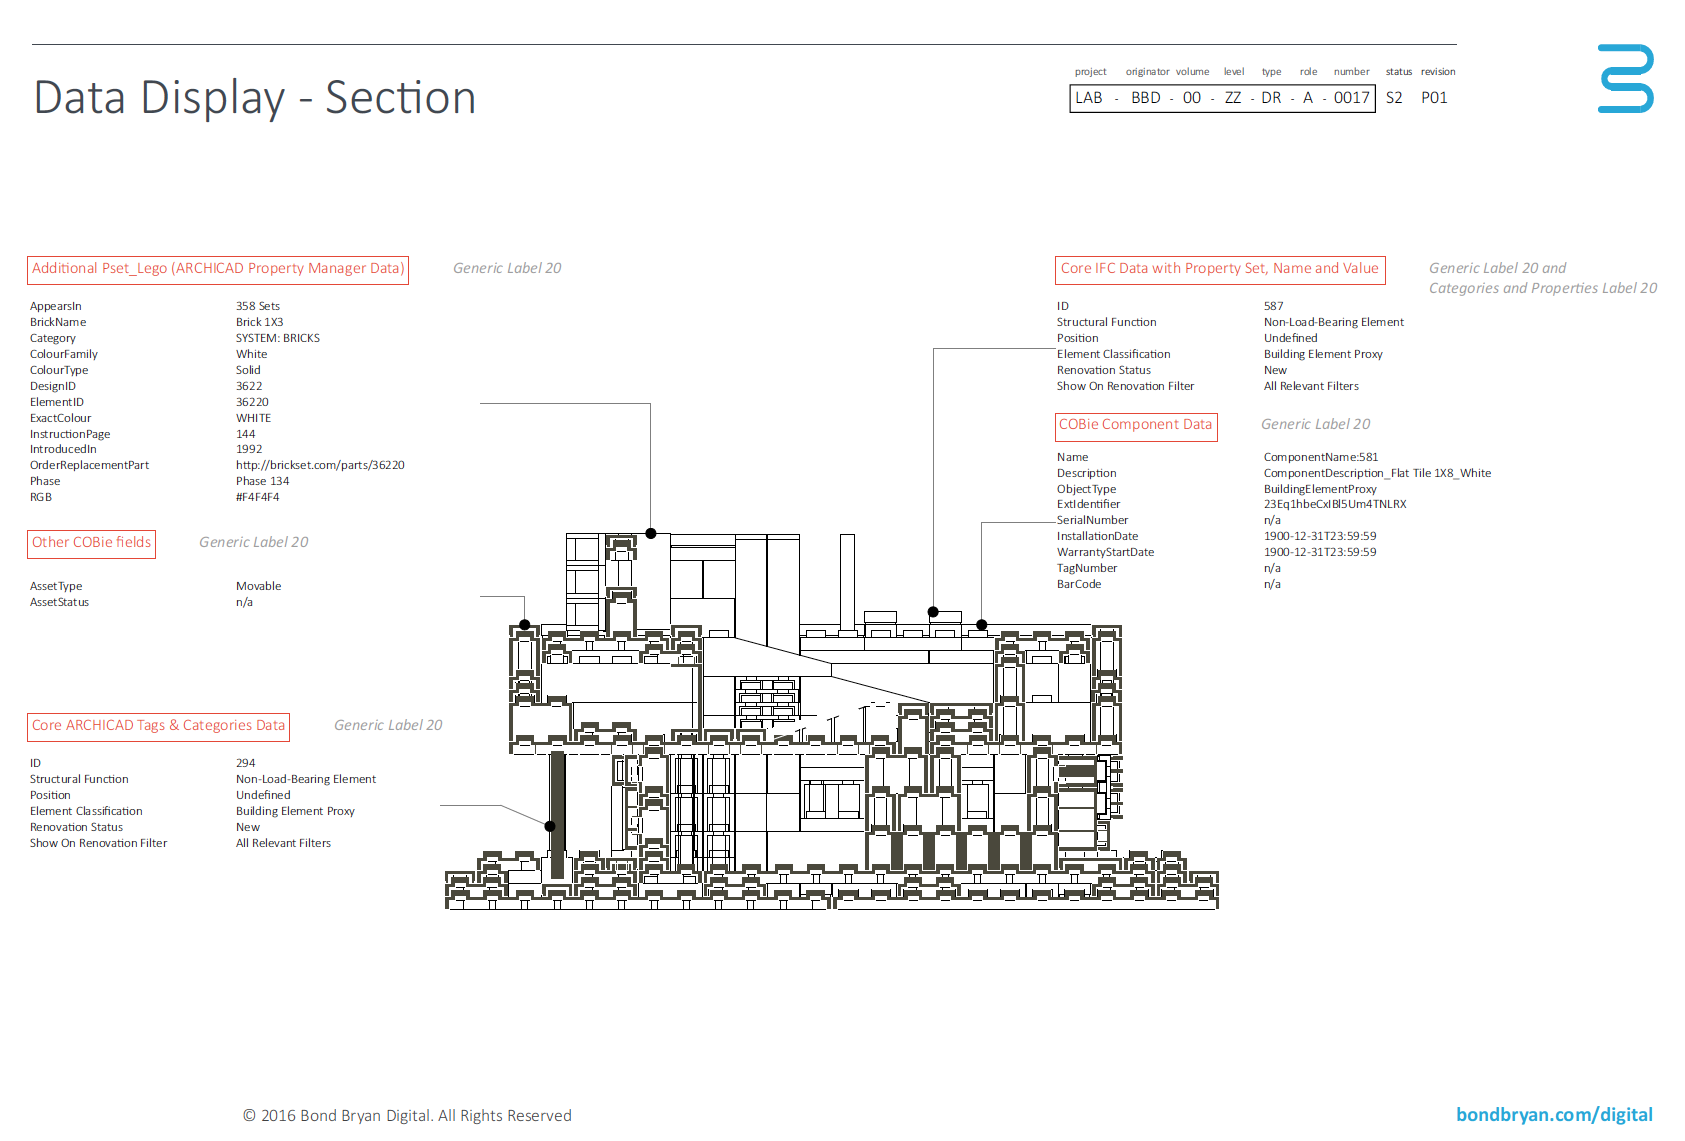
Image: Section view with information extracted directly from model elements (click to enlarge)
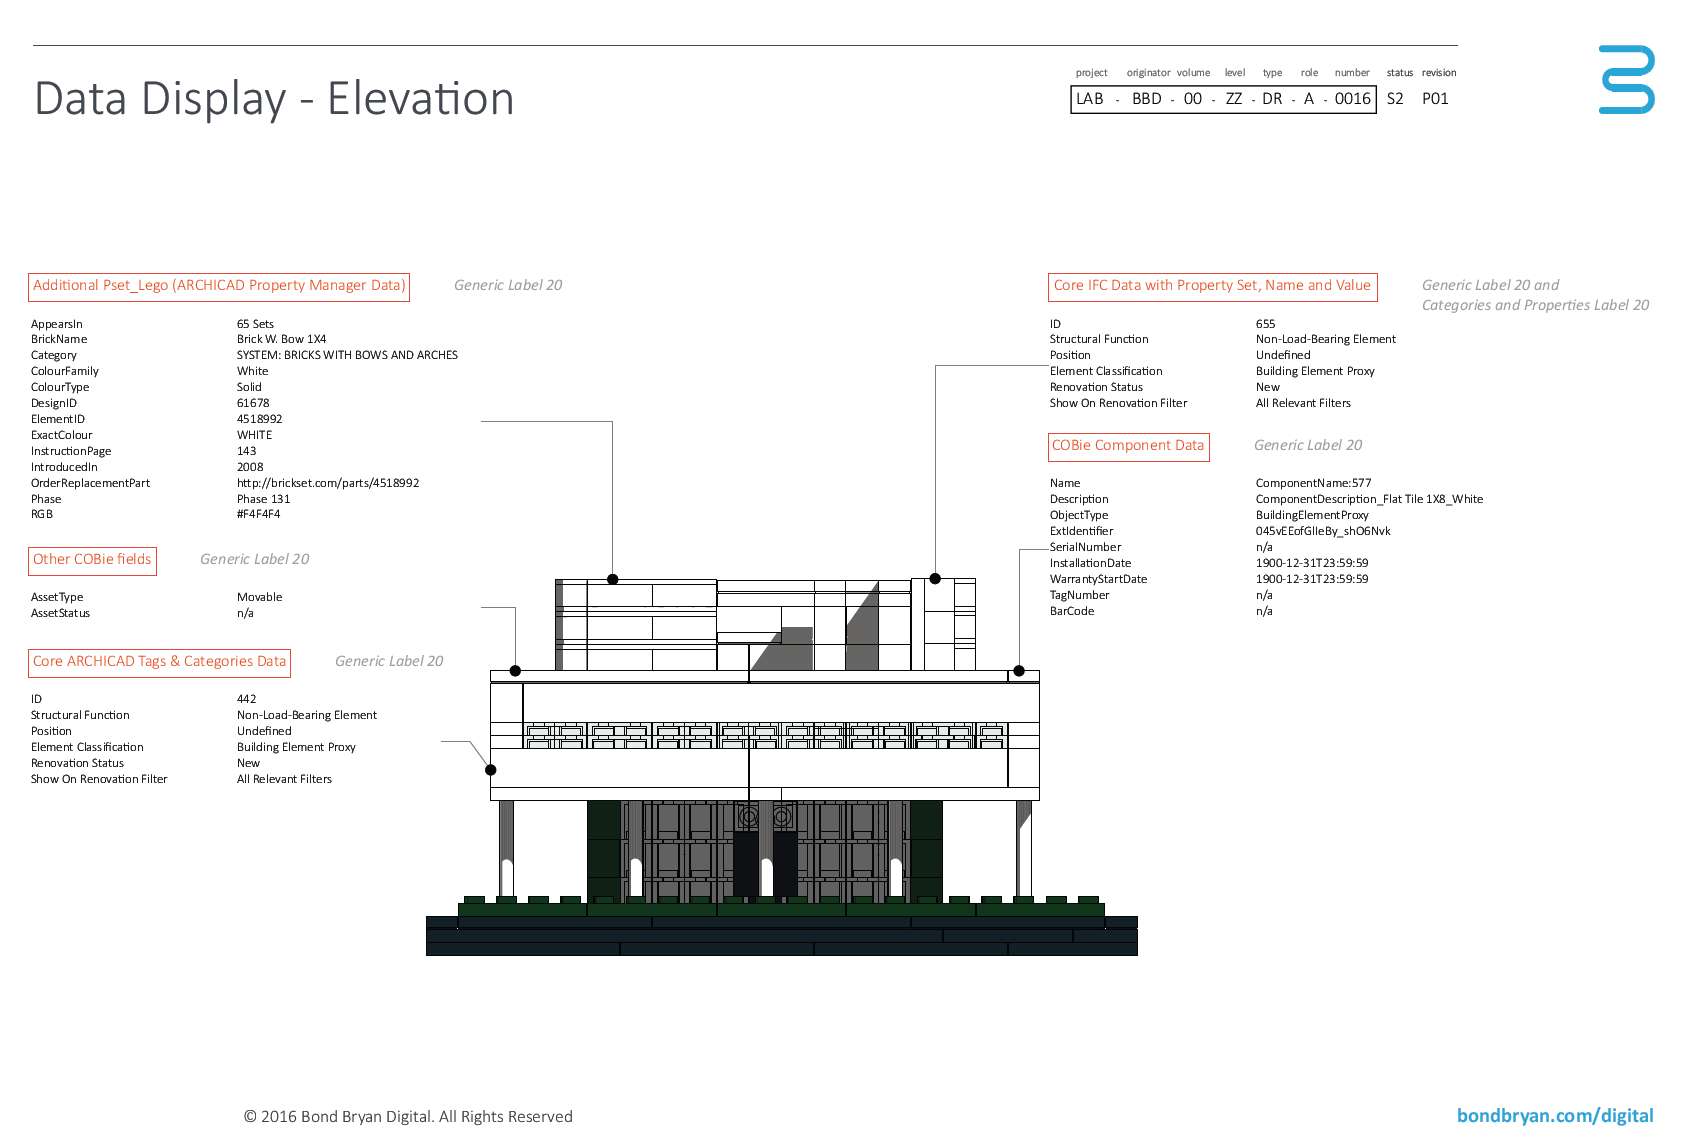
Image: Elevation view with information extracted directly from model elements (click to enlarge)
Often forgotten about is the ability to place 3D views on drawing sheets and the use of model extracted data can also be used with these types of views.
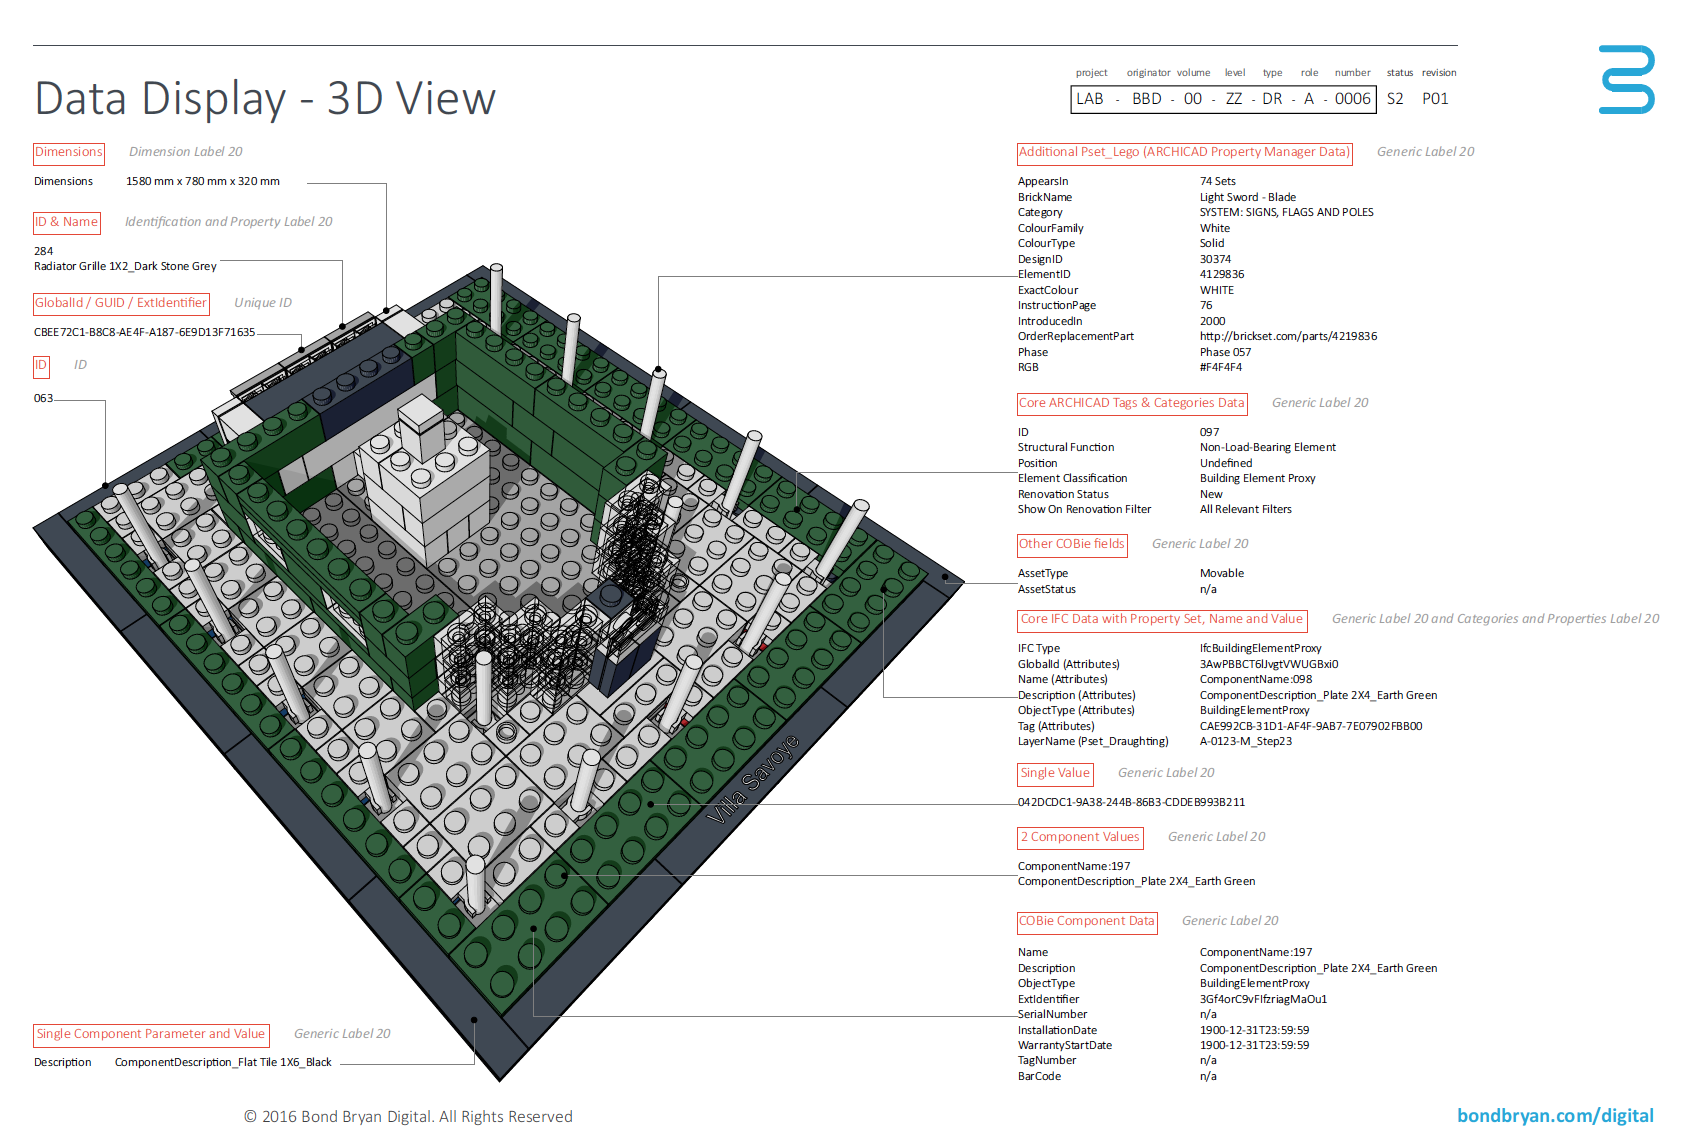
Image: 3D view with information extracted directly from model elements (click to enlarge)
Graphic override examples
Another way to use data from models other than simply displaying the text is to display the data in a graphical manner. This means with settings in authoring tools that data can be shown on drawings to make it easier to understand the information to be communicated. Typically this would be used for information such as displaying fire ratings for walls or to show different wall types.
Note: this function was not previously possible in ARCHICAD before version 20.
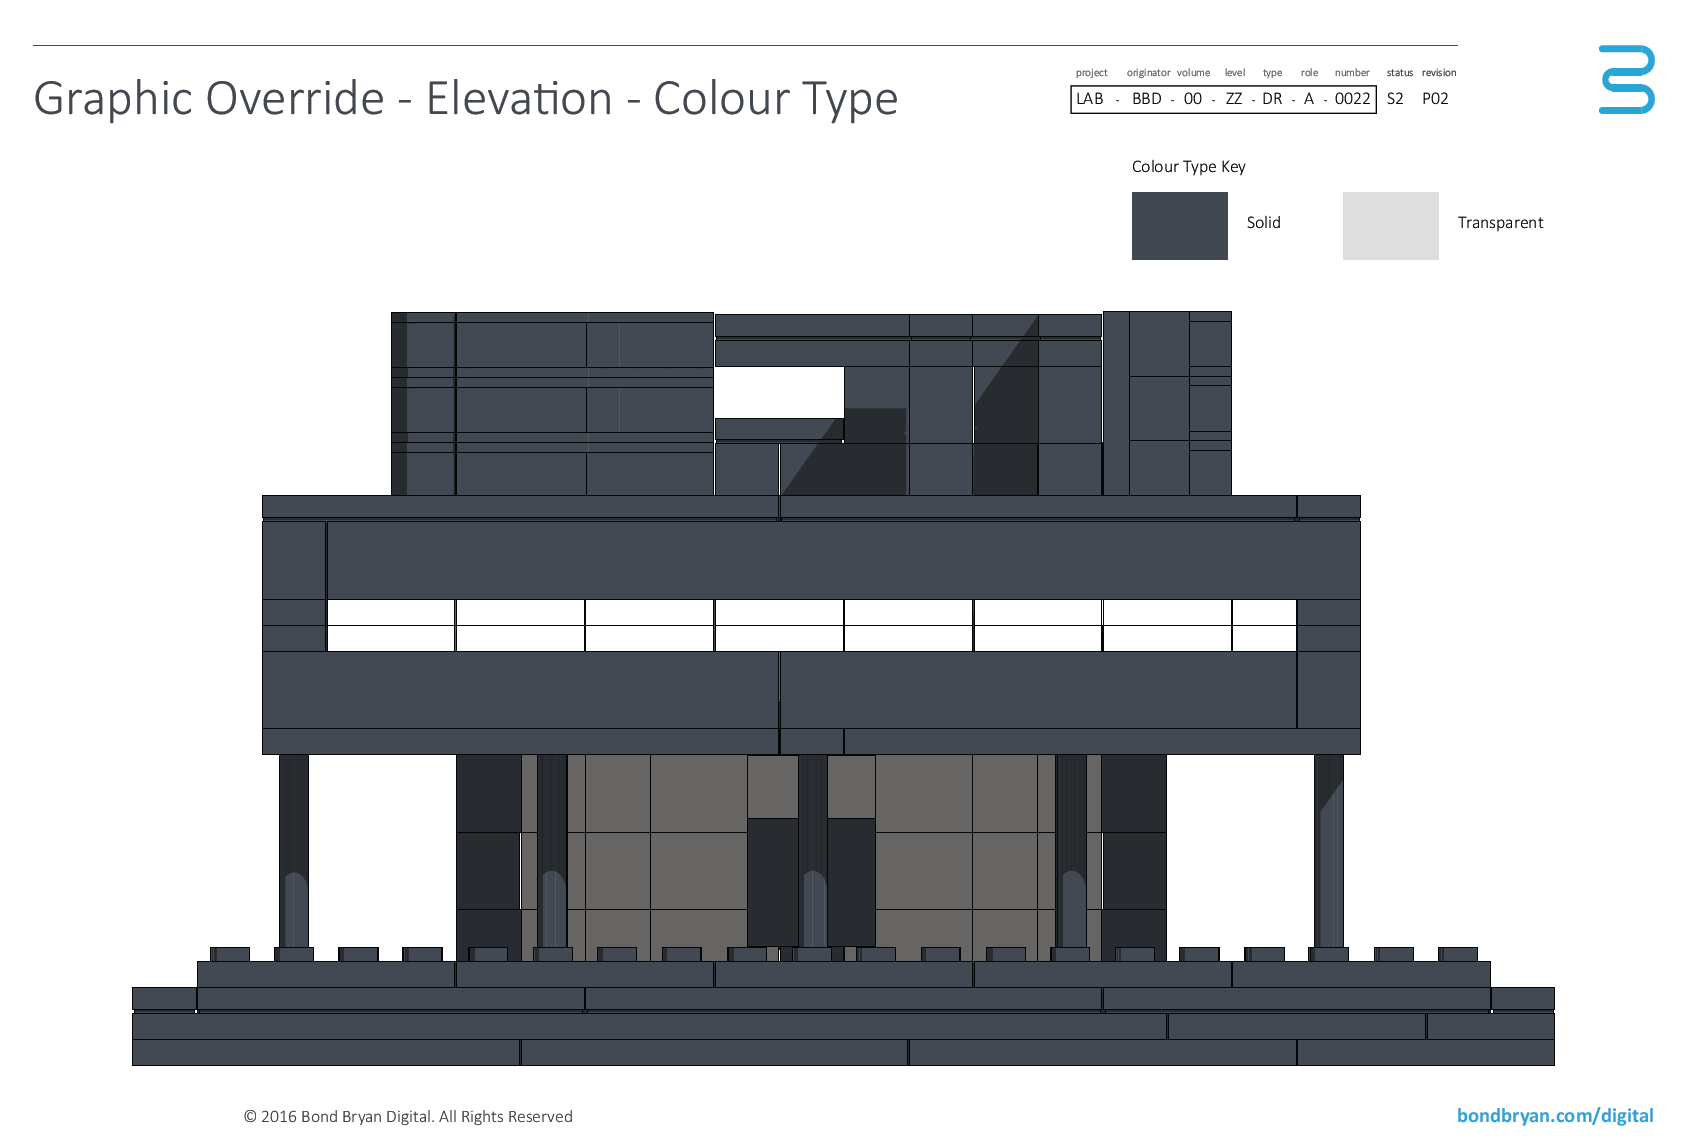
Image: Colour Type data displayed in an elevation view (click to enlarge)
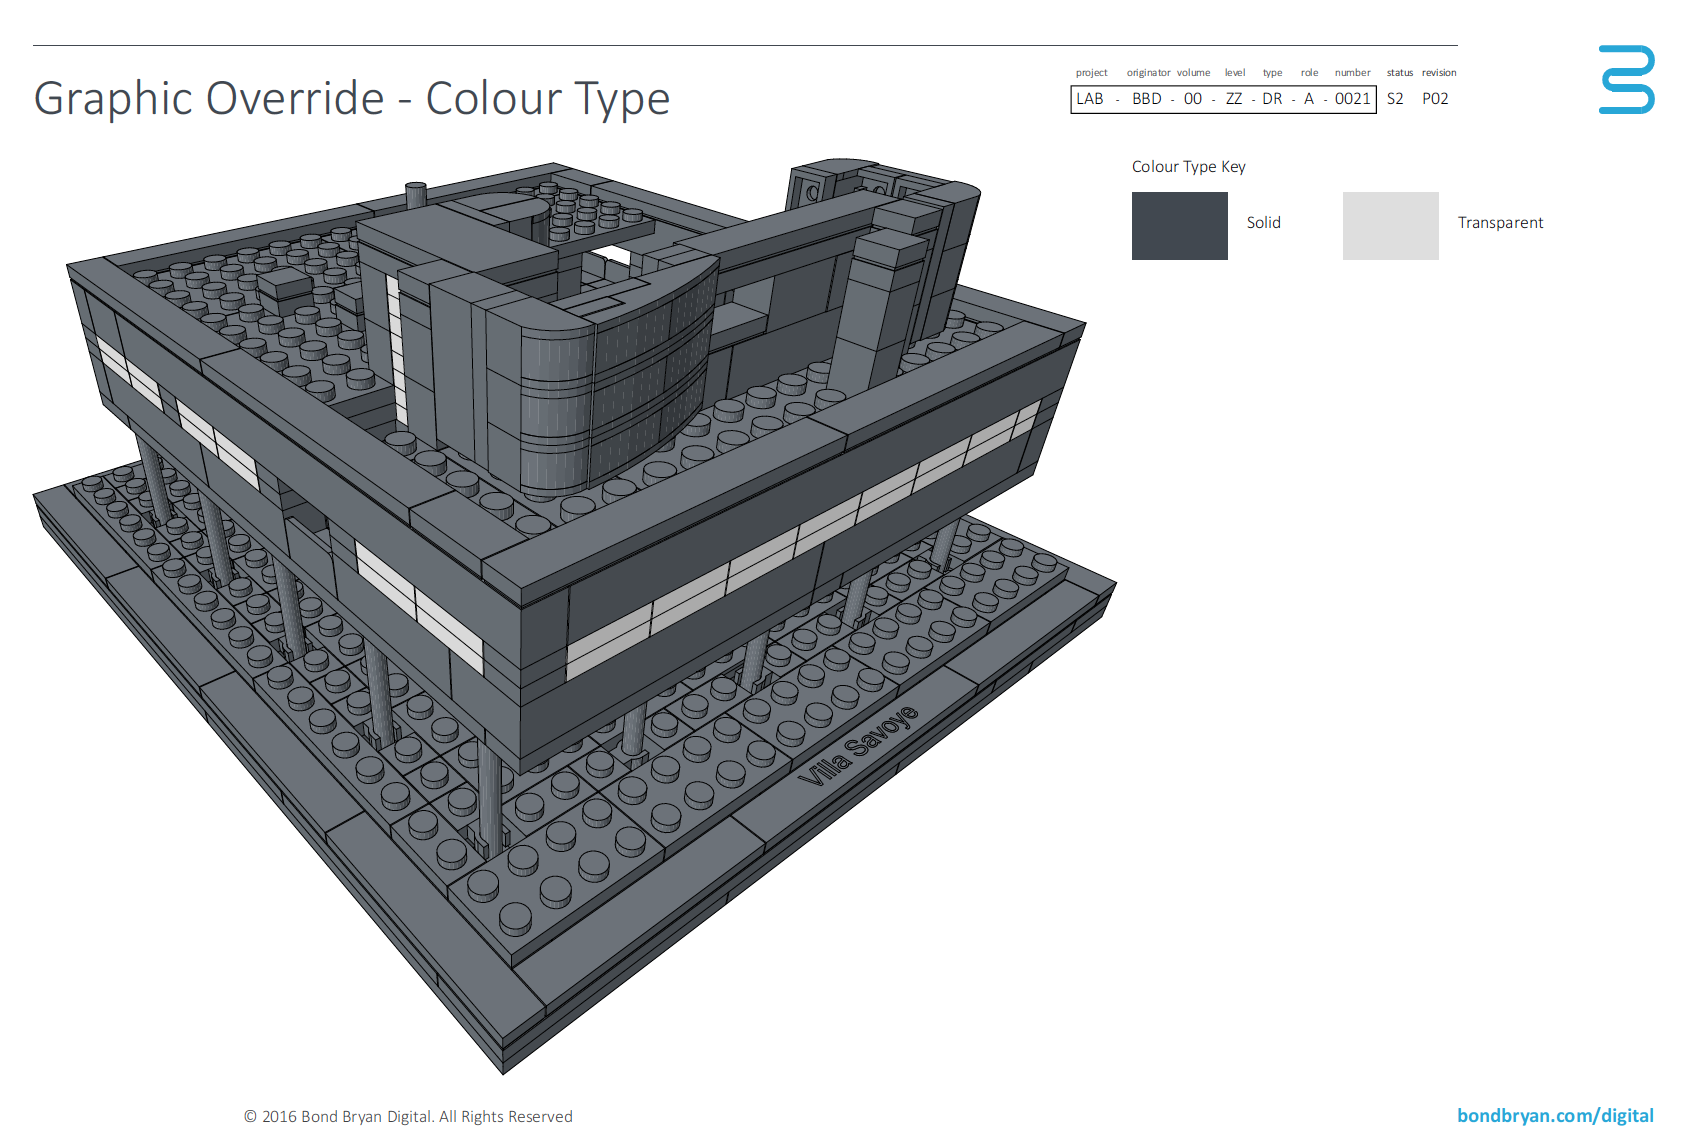
Image: Colour Type data displayed in a 3D view (click to enlarge)
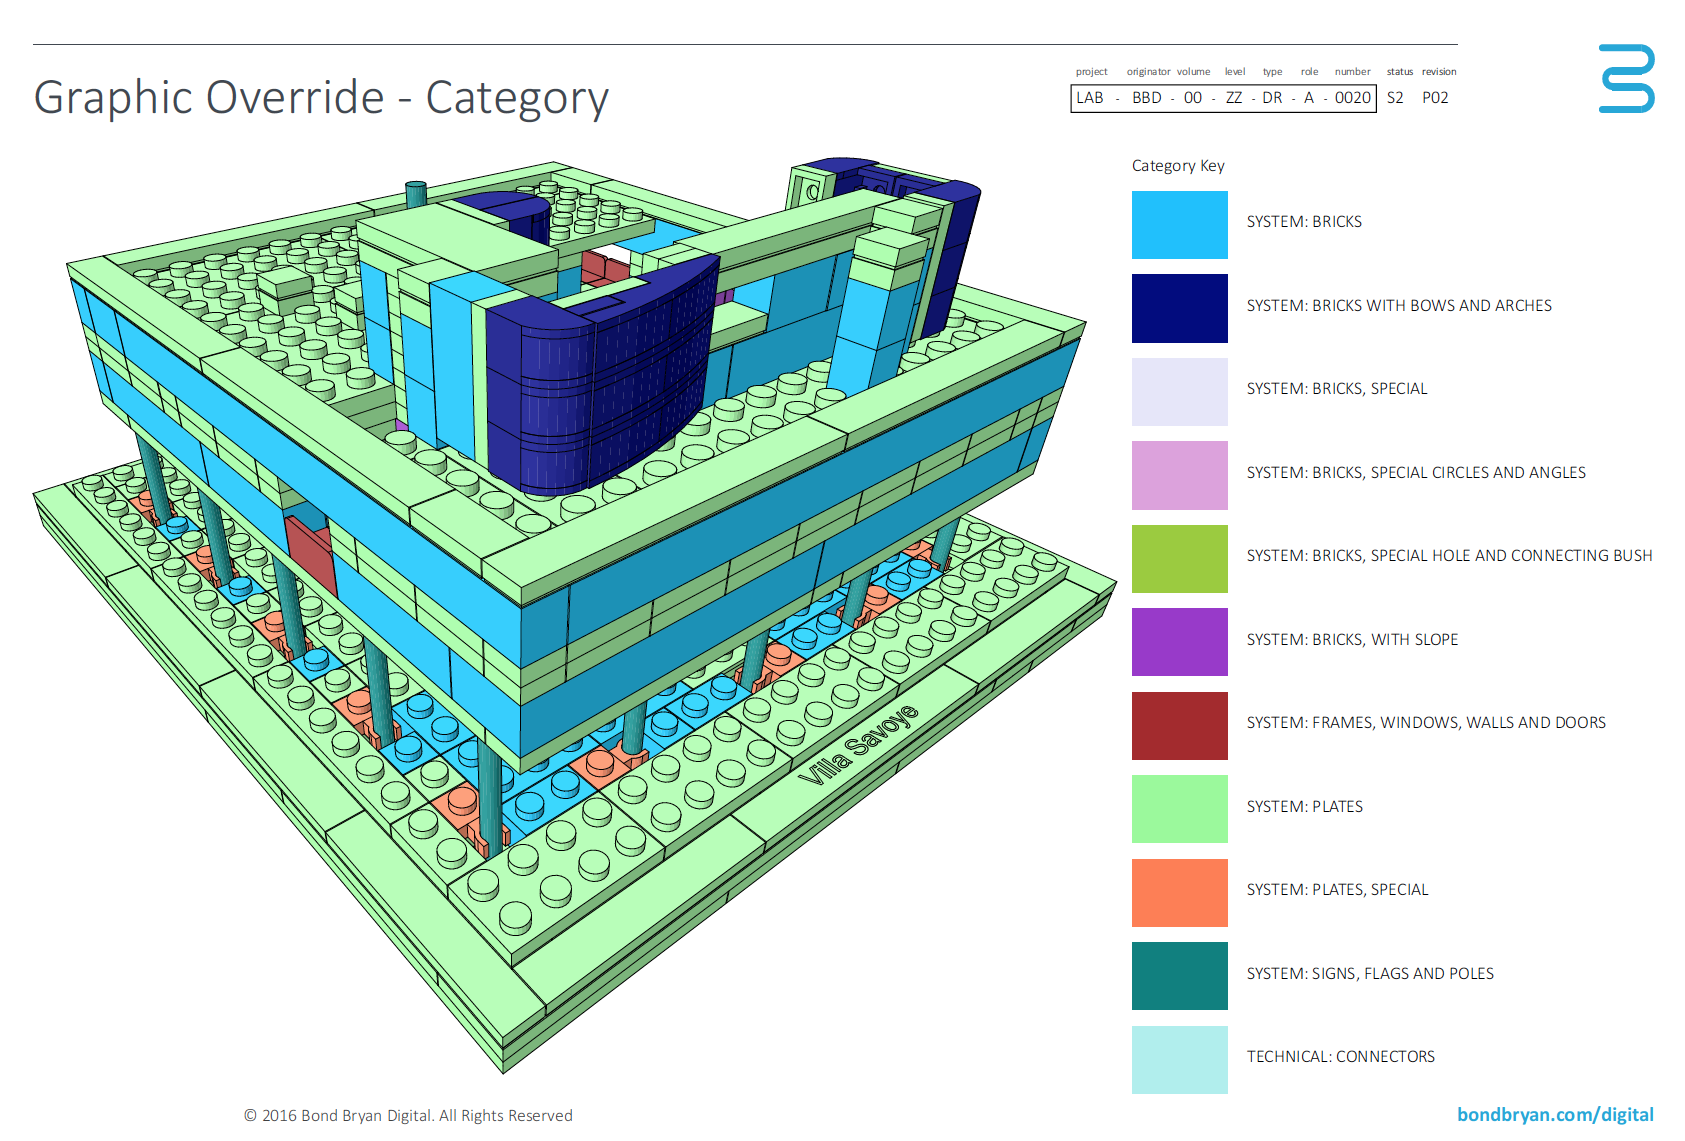
Image: Category data displayed in a 3D view (click to enlarge)
Note: The keys for the graphic overrides of were produced here using Fills and Text to match the model.
Conclusion
The use of data for drawing outputs is a fairly simple use of data but it is a benefit of using a BIM workflow to model authors. Using text (which does still need to be used for some elements of drawing output) is slowly becoming a redundant workflow as access to the data becomes easier with technology improvements. For clients the change to BIM workflows means that the information they receive will be more robust and less prone to errors. This improves the quality of outputs which is another reason for moving towards a BIM approach.
Rob Jackson, Associate Director, Bond Bryan Digital
![]()
Terms and conditions
All content provided on this blog is for informational purposes only. The owner of this blog makes no representations as to the accuracy or completeness of any information on this site or found by following any link on this site. Bond Bryan will not be liable for any errors or omissions in this information nor for the availability of this information. Bond Bryan will not be liable for any losses, injuries, or damages from the display or use of this information.
We are happy for others to share our blog pieces through all social media platforms. You may include links to the original blog pieces and use part of the blog to then provide a link to the original content. However we would appreciate it if the content is not reproduced in full on other sites or publications without written consent being granted by Bond Bryan.
This policy is subject to change at any time.
LEGO and the Lego logo are trademarks of the LEGO Group. Any trademarks, service marks, product names, corporate names or named features are assumed to be the property of their respective owners, and are used only for reference, without intent to infringe.